Understanding App Store Pricing — Part 5 Pricing Kaleidoscope
By now you are probably wondering how much more this Jury guy can go on about elasticities and pricing and all the rest of these shenanigans. Well, this post will wrap things up on this topic. I've have spent the past four posts extolling the virtues of demand curves, revenue maximization, charging what your software is worth, and avoiding being a commodity. In this post, I'm going to show you how you can take real world data and use it to make better real world decisions about how you price your app.
As a backdrop for this, I'll be talking about real world data from Kaleidoscope 2 a fabulous image, text, and folding diffing and merging application by Black Pixel. I previously shared this data at NSConference 5 as part of my talk there.
Pricing your app is probably one of the most difficult things you will ever do. It often feels like a shot in the dark at best and a wild-guessing game at worst. It's important to remember that there are a few things you can do ahead of time, and some very interesting things you can do later, to understand how successfully you may have priced your application.
From the start, I recommend doing the following three things when pricing your app, the first two of which should absolutely happen before you do any development:
- Understand your market segment
- Research your competition
- Make an educated guess

Average selling prices from the Top 25 apps from each segment. Not all segments are created equal.
Understanding your market segment is vital before you write any code. Not all segments are created equal. While your app may be able to carve out a unique position among its peers, it can be very hard to overcome the prevailing trend of your segment. So before you do any development, take a hard look at your primary category and think about your proposed app. How useful is it really? Is it actually something that could be considered crucial to anyone? Will your dreams of high prices stick out like a sore thumb?

Leaders in the Developer Tools segment
As we set out to develop Kaleidoscope 2, we were buoyed by the relatively healthy pricing in the Developer Tools segment. A $30.11 average selling price, with plenty of apps we knew and respected that commanded a premium price. We felt confident there was a chance to charge a reasonable price and not be an outlier. At the same time, our market research made it clear we had something that had potential — Kaleidoscope and its 2.0 feature set would be super useful to a great many people. A polished UI, image comparison, folder comparison, text comparison and merging, it wrapped a lot of important use cases into a great package. At the same time, it was clear to us that Kaleidoscope was not crucial and there were available alternatives, such as FileMerge, diff(1), and doing manual diffing and merging. Even so, we felt confident and trudged on.
Next, we turned to a competitive analysis. There are a fair amount of diffing and merging apps out there, many of whom are quite capable. Sadly, they all fall down when it comes to visual design and user experience. Without getting too negative, many of them aren't the prettiest tools in the shed.

And yet, despite their looks they were typically very featureful and commanded an average selling price of $54.79. This was reassuring insofar as it made it clear we had a more premium market, operating at a sustainable price, and likely in desire of a well organized, easy to use tool. So with that in mind we set out to try Kaleidoscope 2 at two different price points — an initial launch at $34.99 and an eventual full price of $69.99. On November 19 we release Kaleidoscope 2 as a public beta, and on January 17th we released the final version on the Mac App Store.
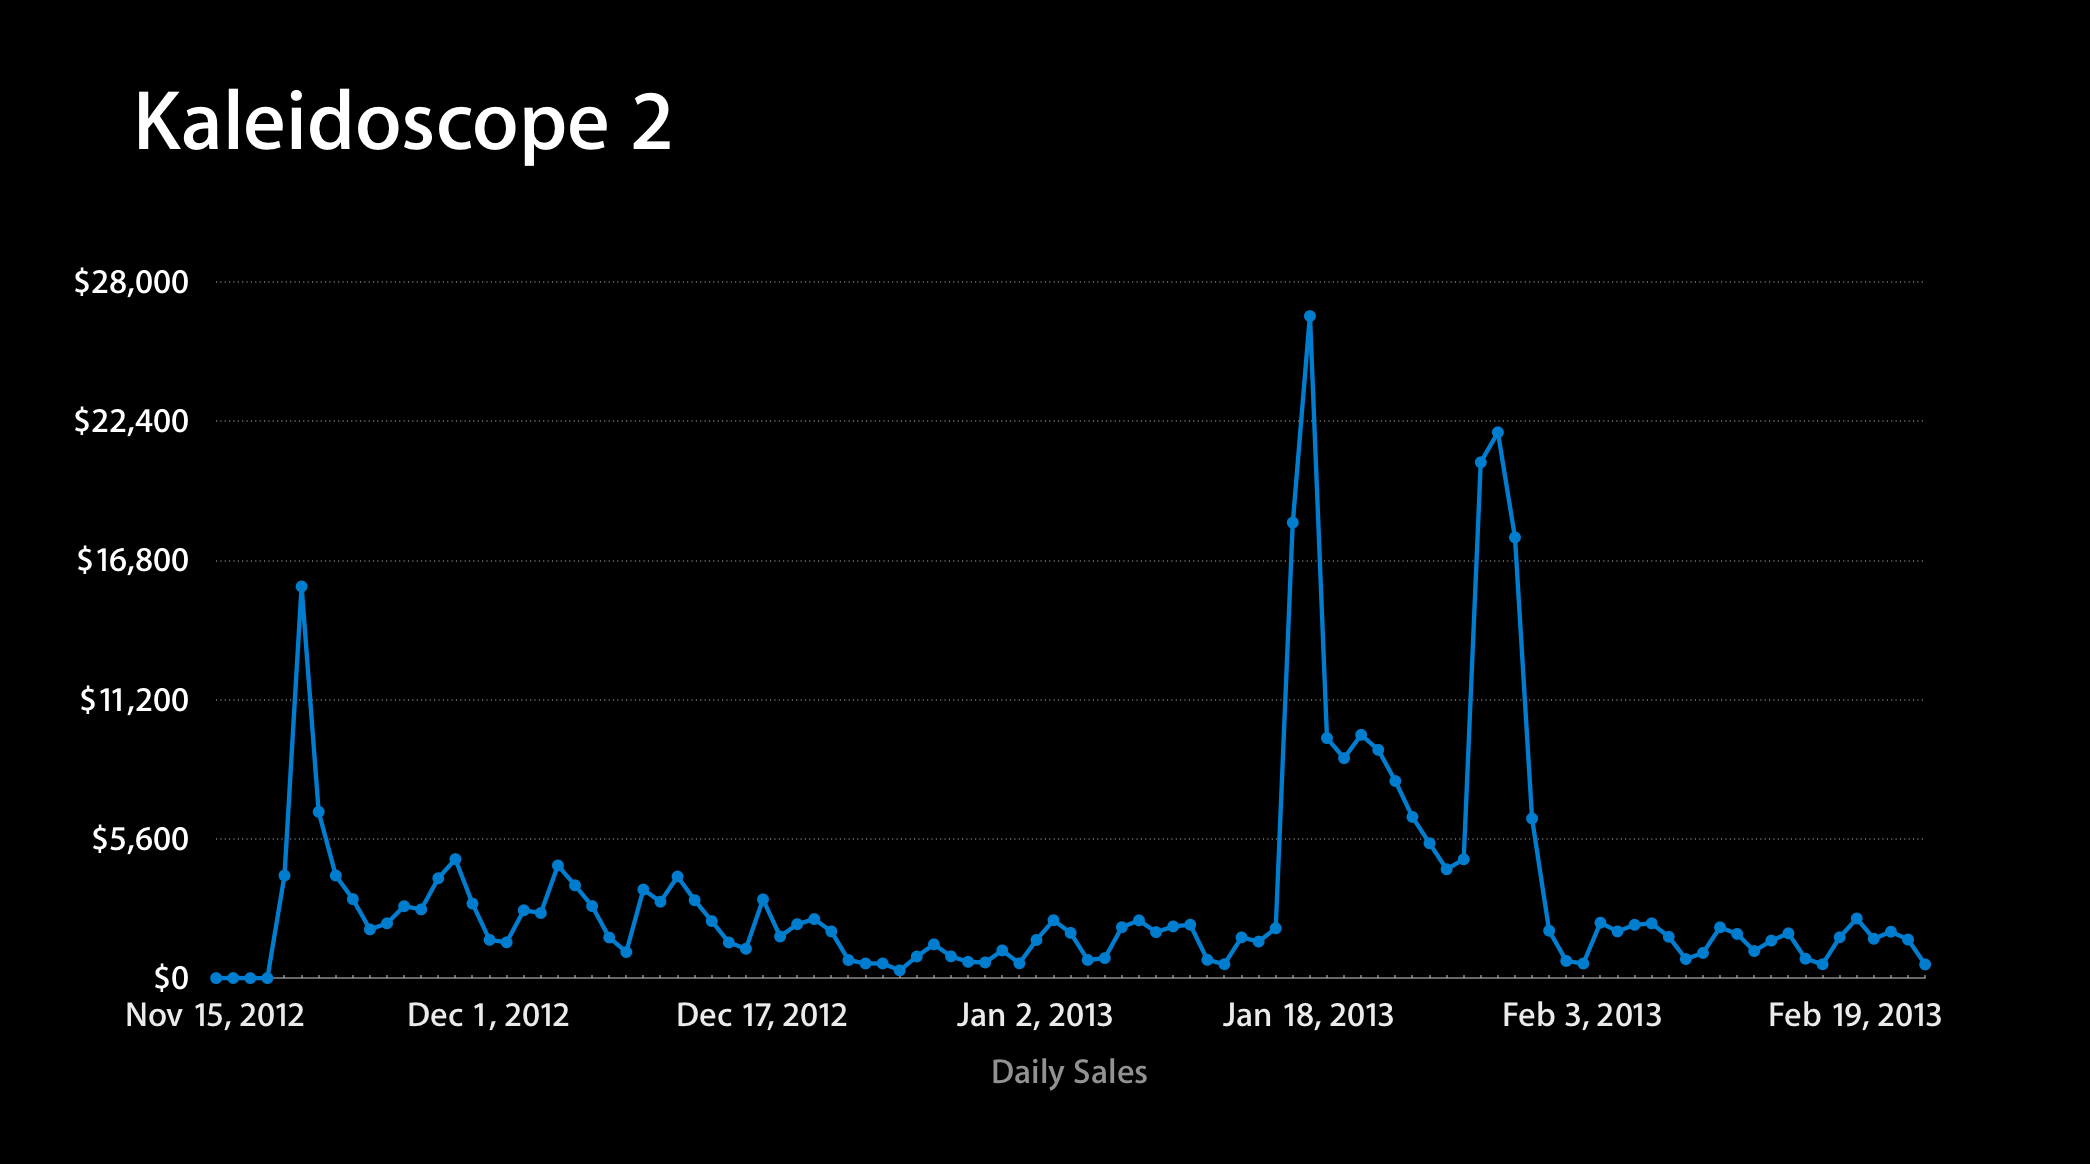
Kaleidoscope sales from November to mid-February
Kaleidoscope did quite well in that time, and if you look at the broader landscape you might conclude that we had done a good job and should keep on truckin'. We had cleared $375,000+ revenue in three months, averaged $3,327 per day in sales, and sold an average of 110 copies per day. But here is your first important lesson — averages lie. The spikes we saw around launches massively skew the dataset and only serve to hide longer term trends.
What we really needed to do was take a look at the portions of the graph where more steady-state data might appear. These would give us a more honest and unbiased look at our real trends and would help us figure out if we were pricing our app appropriately. Based on the spikes in sales, the lull at the holidays (I guess no one diffs over Christmas, who knew?), and the steady state after the App Store introduction, we settled on the following time windows:

Average daily sales in three distinct time periods: Post launch, post-holiday, post App Store launch
So we've got some sales numbers, now what do we do? Well, based on the above data, and seeing that when we doubled the price (the rightmost box) our revenue actually remained unchanged relative to the post-holiday (middle box) baseline, I theorized that we had likely swung from the right-most side of our revenue curve to a corresponding point on the leftmost side of our revenue curve.

But to empirically answer the question of "what price should we charge", it's time to turn back to our old friend Price Elasticity of Demand. You see the Price Elasticity of Demand is a wonderful ratio that can tell us a lot about our product and our buyers if we can give it the proper data. In its most basic form, the Price Elasticity of Demand is expressed as the percentage change in price of a good, divided by the resulting percentage change in quantity sold. It's a measure of the relative impact of changes and, as such, is incredibly powerful. (Note that more textbook definitions of the Price Elasticity of Demand involve derivatives of demand curves, normalized for prices… but I'm just going to go ahead and assume you probably don't have the polynomial representation of your demand curve sitting in front of you.)

The Price Elasticity of Demand is a ratio that expresses the magnitude of the relative change of prices and quantities.
With this ratio in mind, we need only determine what our average quantities were at given points in the past to begin having some interesting fun. Let's do that.
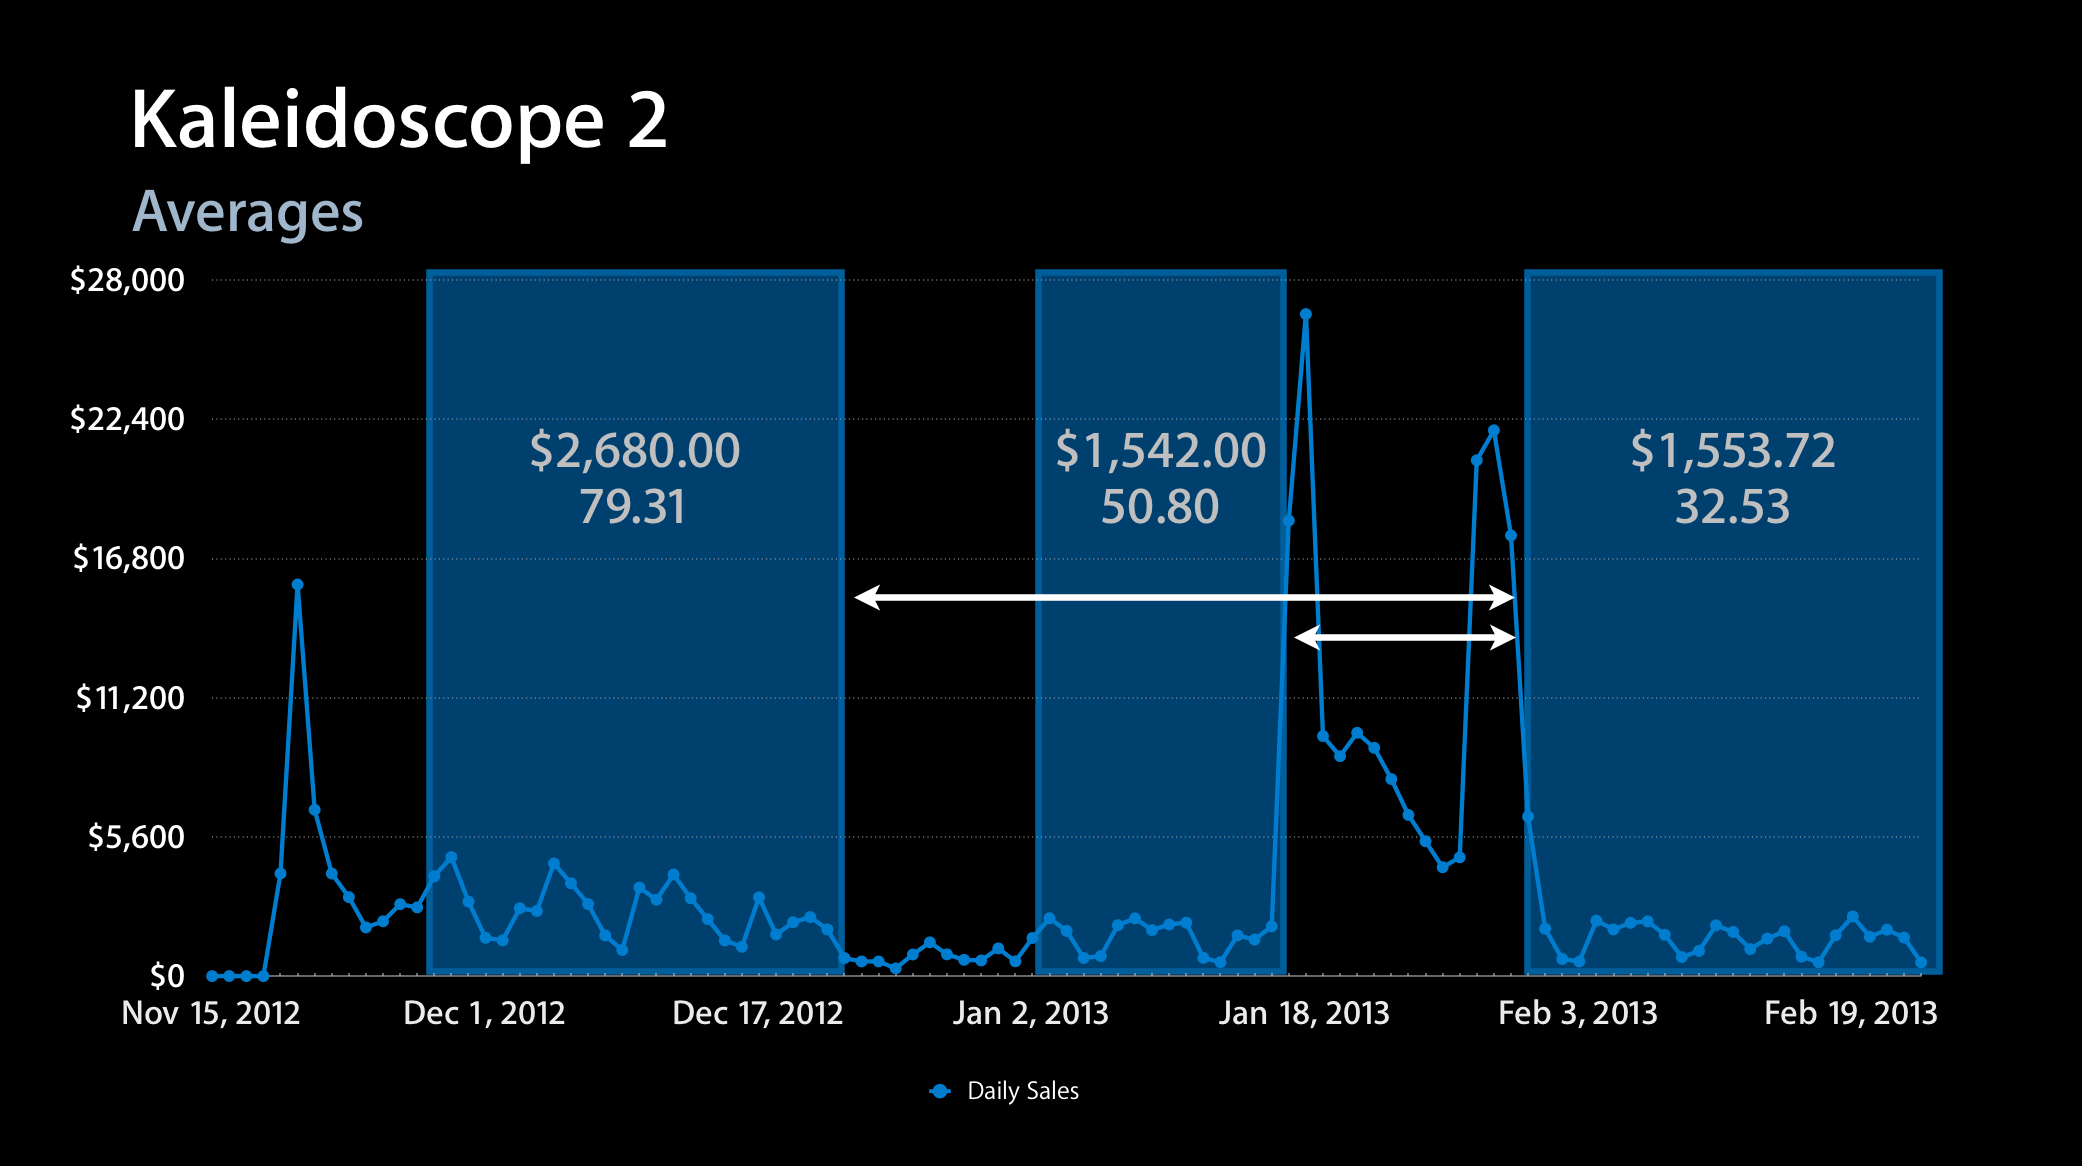
Average selling prices and average quantities sold are listed in each box
The worthwhile comparisons are from before and after the price change, so the rightmost box compared to the middle and leftmost. We can summarize this data, and the associated Price Elasticities of Demand in the following table.

Price elasticities for both time periods.
For a variety of reasons (mostly to keep things simple), I'm going to focus on the Early December vs Early February data for the rest of this post. You see, the brilliant thing about this simple ratio, is that it provides us with the power to do some real empirical prediction of what combinations of price and (predicted) supply will maximize our revenue. We simply need to remember that our starting point is a price of $34.99, a quantity of 79.31 units, and a constant Price Elasticity of Demand of -1.696. (It's important to note that elasticities are rarely truly constant over the length of a demand curve. However, the mere presence of data for us to work with provides a better guide than no data at all. It's a simplifying assumption to assume a constant -1.696, but also a fairly safe one.)

Our golden ratio.
Armed with this equation, it's a very simple bit of algebra to determine what impact a given percentage increase in price will have on a percentage decrease in quantity sold. And, of course, since Revenue is Price times Quantity, we can even spot what looks like our Revenue Maximizing point:
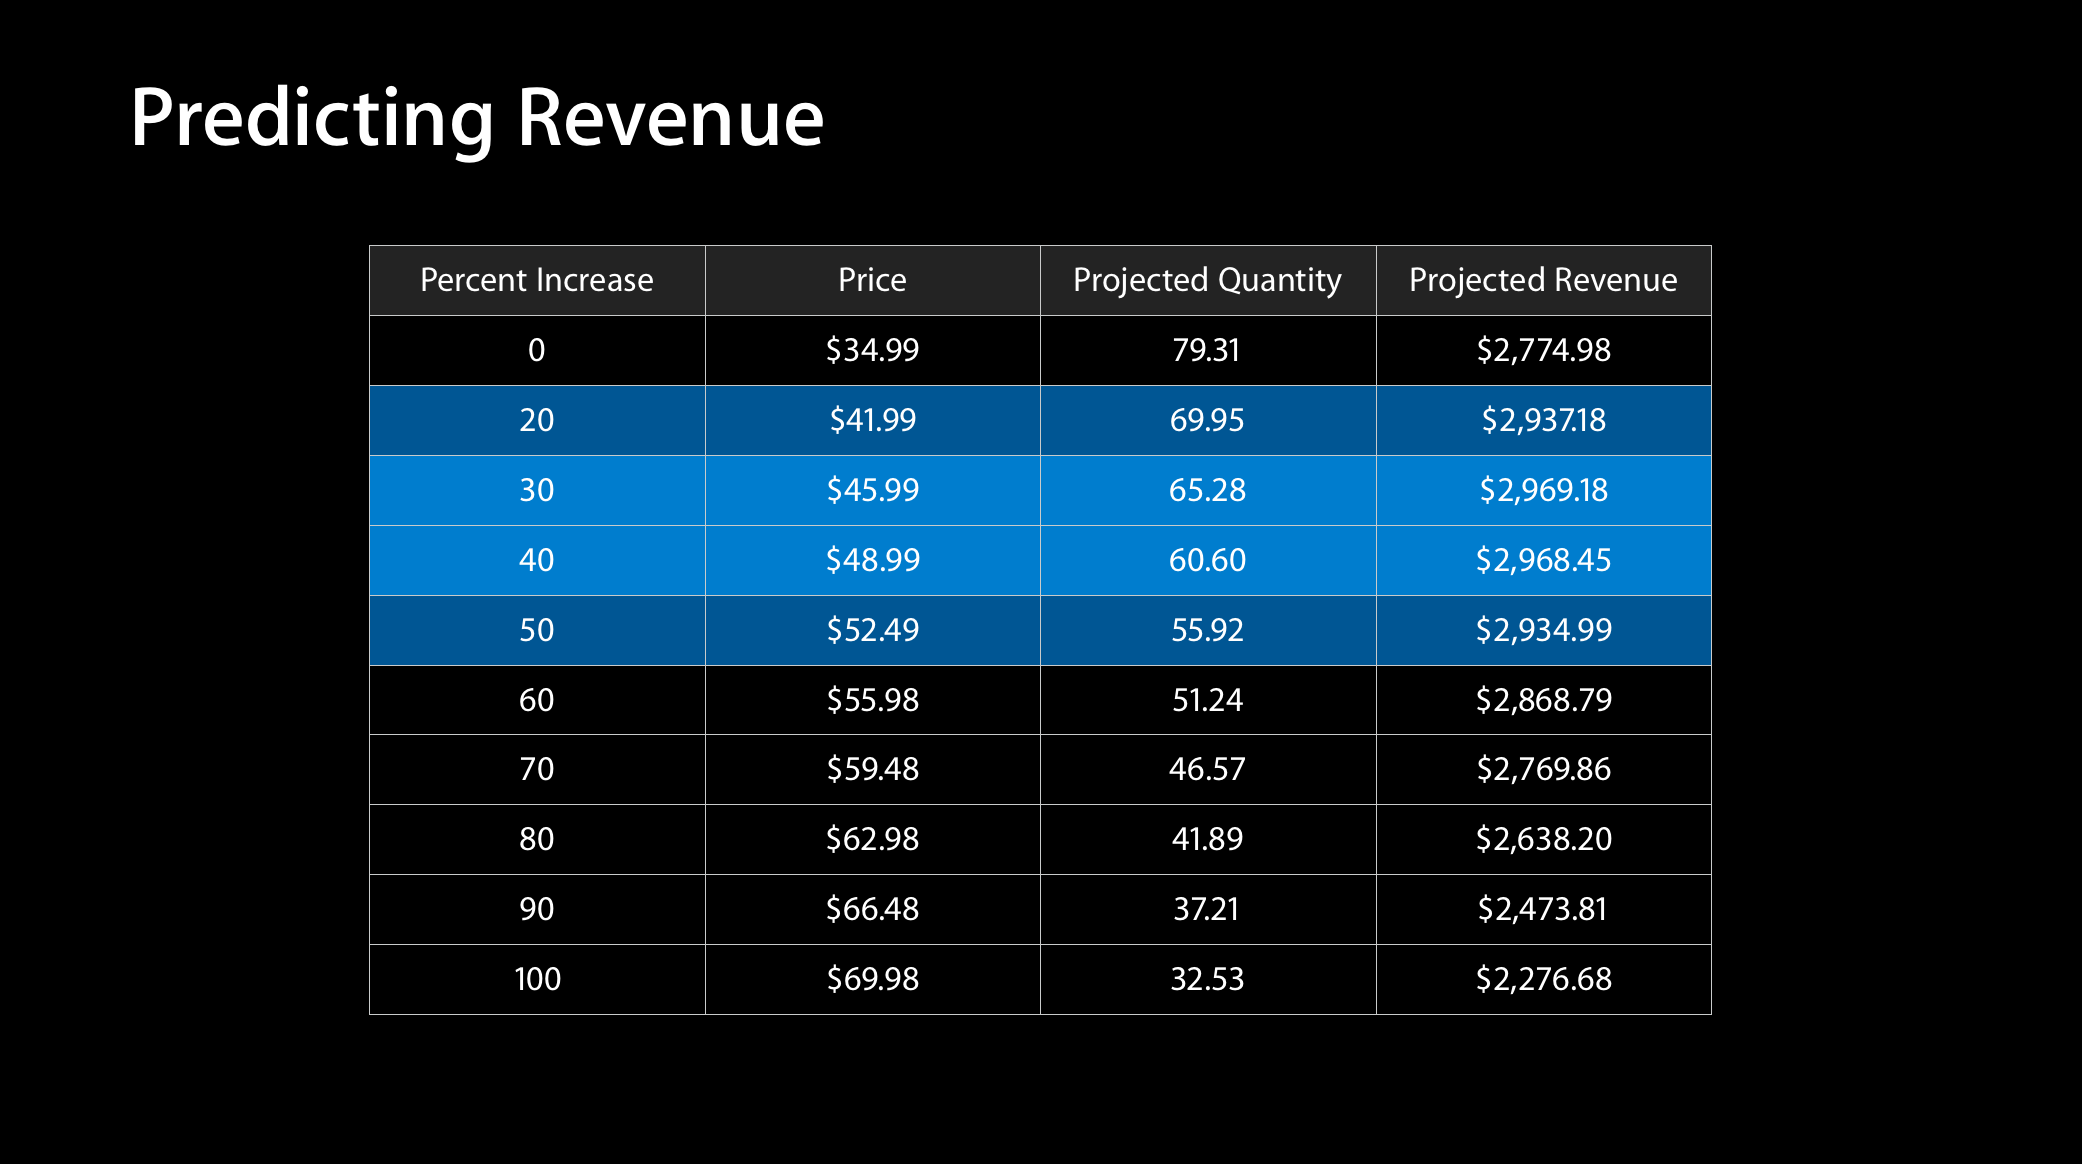
Percentage price increases times projected quantities equals predicated revenue.
And if tables aren't your thing, I've even got a nice graph for you to check out (don't worry, I like graphs better, too):
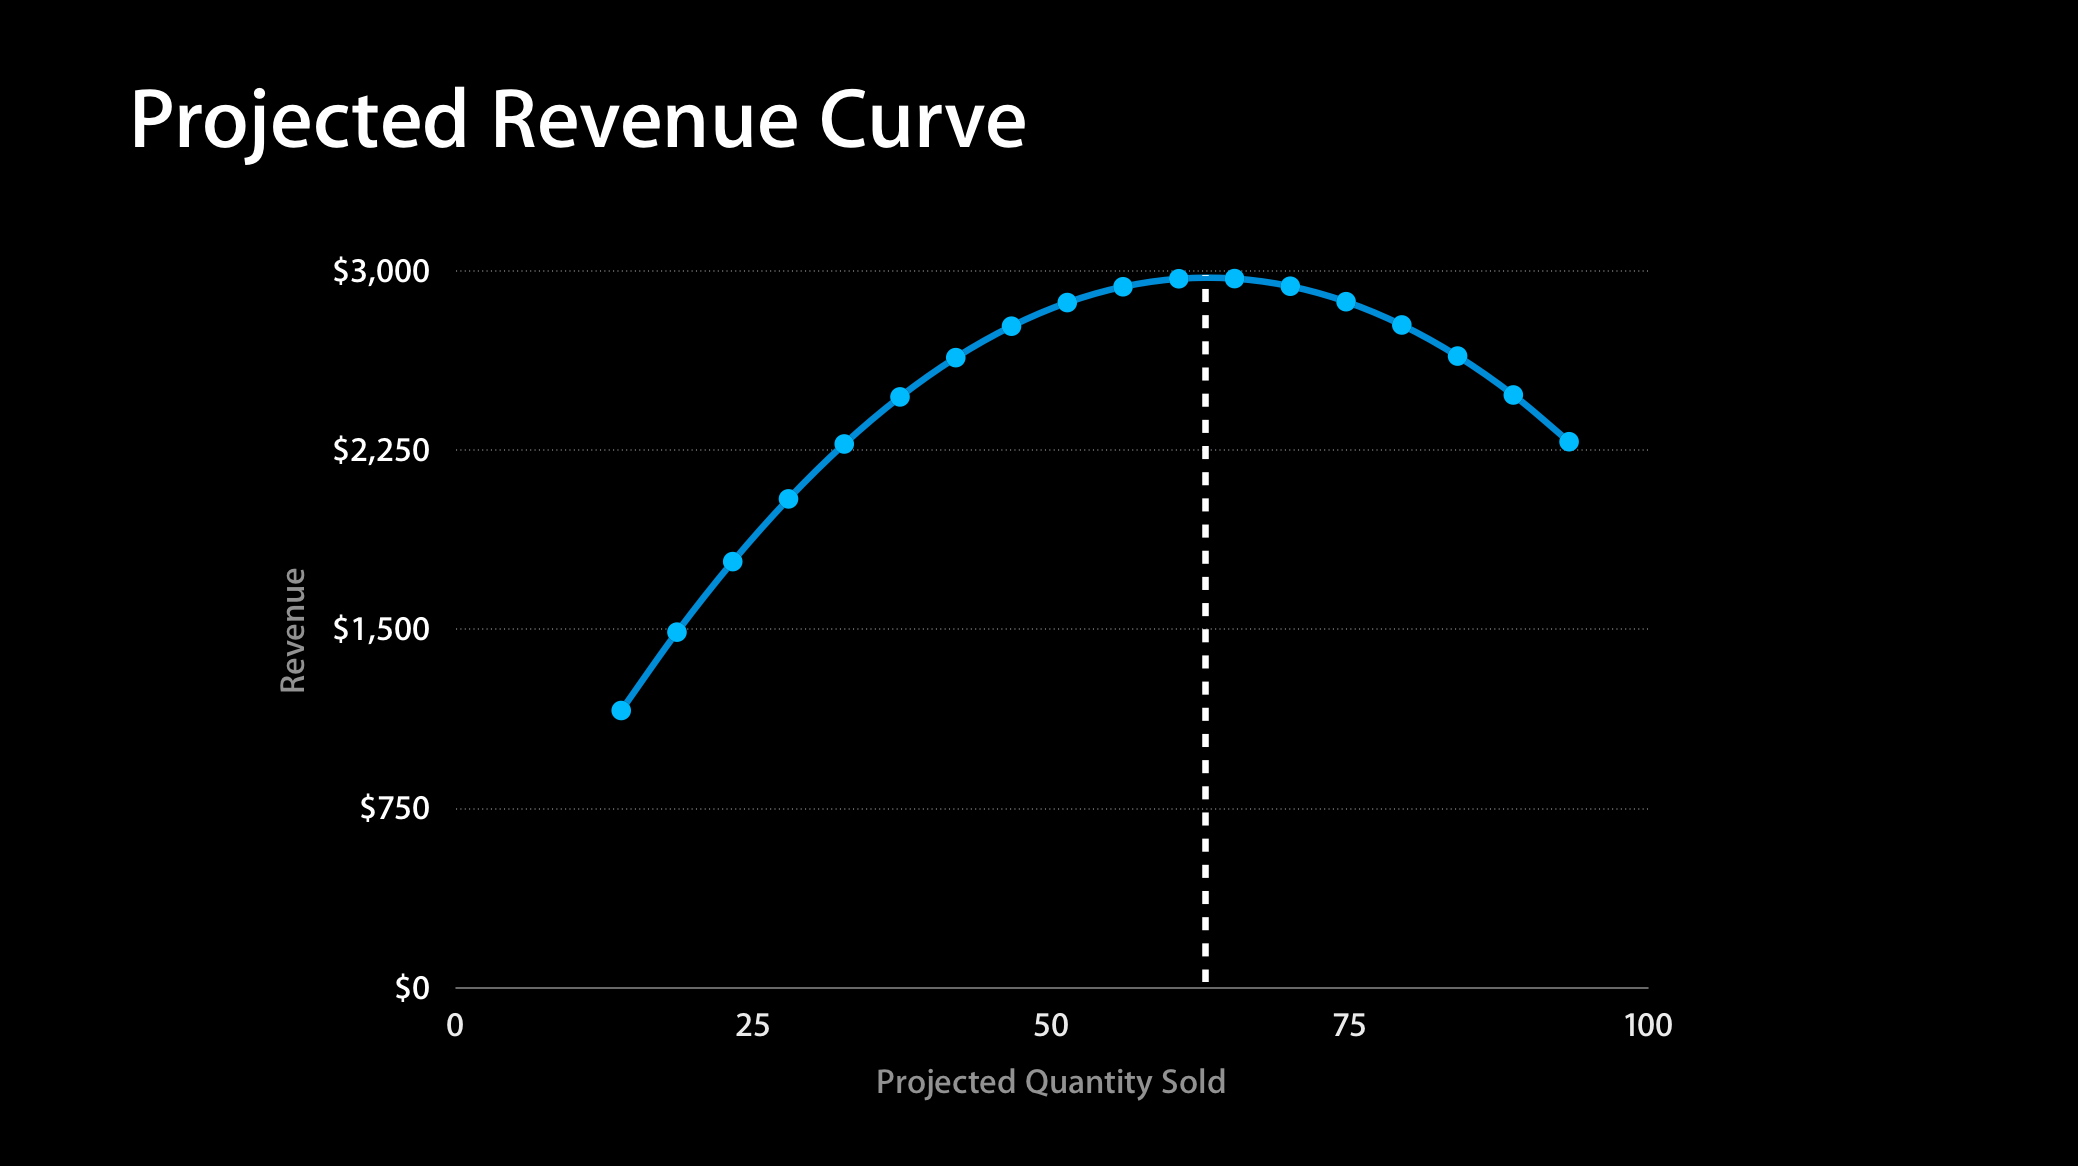
Graphing projected revenue based on predicted quantities and hoping to spot our revenue maximizing point.
As you can see, we've gone from a simple set of data around the price change of our app, a longish and reliable steady state of data from before and after that price change, and used it to help us predict how demand might respond to our price changes and what prices have the best chance at maximizing our revenue as a result. Wow.
Now, this approach has some sizable limitations. In this case we had decent but limited data to work with. The holidays really created some interesting effects, and it's hard to take those fully into account in the absence of other data. As I previously discussed, we are using a simplified measurement of elasticity that essentially amounts to one big average and elasticities are usually not constants along a demand curve. Nonetheless, I'd rather operate on an educated guess than a pure hunch, so here we are.
Most of this post has been fairly technical, and it may be easy to get lost, but I hope you can appreciate from this data just how absolutely doable it is for you to apply this same technical rigor to your own apps. Don't just change your price and pray. Measure, change, and measure again. Look for learning opportunities. More than anything, treat pricing and the business end of your app development with the same technical rigor that you would your technical design, debugging, or user experience.